If you’re using invidious and have the web client, iOS or android client like Yattee… wouldn’t your default feed essentially be a playlist of all new videos?

zelifcam
- 1 Post
- 31 Comments
Joined 1 year ago
Cake day: June 19th, 2023
You are not logged in. If you use a Fediverse account that is able to follow users, you can follow this user.
It seems that the commenter’s intention was clear to everyone except you. The commenter acknowledged the need for RAID software or a specific file system, mentioning that it had already been addressed. Understood the budget and OP being an newb.
Although their tone may have been blunt, they stayed focused on their original point.
But you just kept nagging. lol
Either way OP was helped and now you can sleep knowing you did your part. A true internet hero.
deleted by creator
I’m not running iOS18 beta. I don’t have an app called Feedback. ???
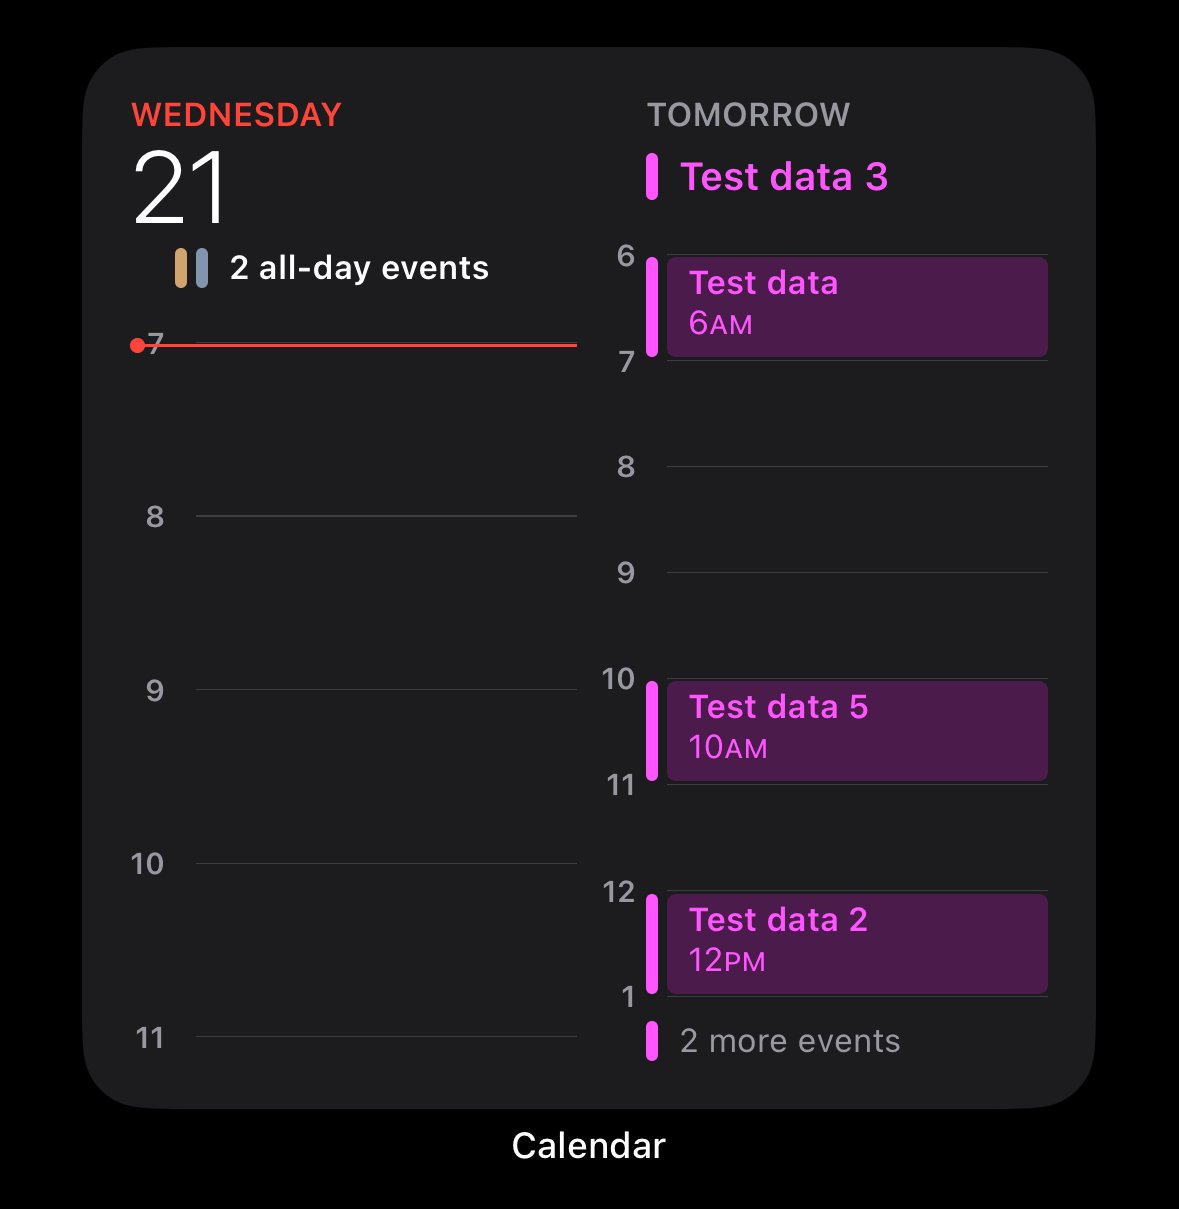
And for the record, the specific calendar widget the user posted from iOS 18 looks exactly the same as the one in iOS 17.
This whole thread is pointless.
It still looks terrible IMO.
Edit:
I agree. Luckily the iOS 18 one is a little better.
It’s not differentl. It’s the same as iOS17.
Why it’s terrible.
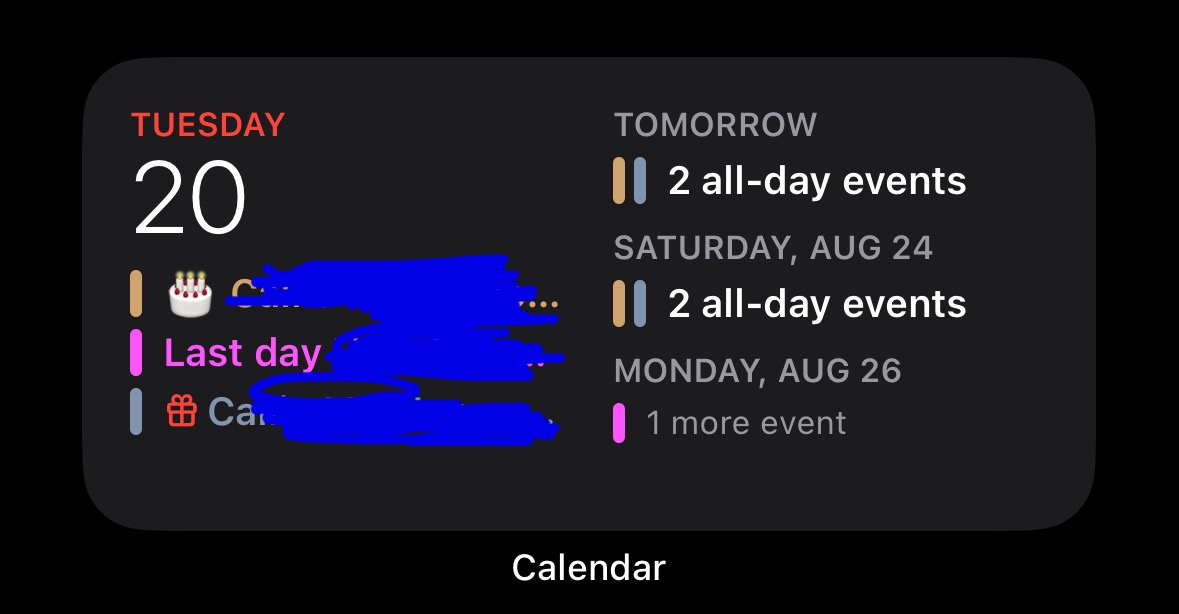
- What are the “2 all-day events”?
- Why is HALF of the widget wasted white space.
- why are there 3 more events if half of the widget is wasted white space.
Edit: I’m familiar with the widget. I don’t need someone explaining to me how to click on a widget. I get it. I also understand it’s different than the one I posted. It’s called “Up Next”.
Despite which one you pick, they’re all poorly designed. It takes up a third of the screen and does a bad job at presenting as much information as possible within reason.
Edit 2: That specific calendar widget you posted from ios18 beta looks exactly the same as it does in ios17. This thread is pointless.

 0·30 days ago
Then there has to be a firewall, web server whitelist or some kind of configuration issue with the service being hosted. Because according to all your responses they are on the same WiFi with the same subnet/gateway/netmask.
Same netmask?
When asking for network troubleshooting assistance, super useful to provide ANY kind of network info. So far we have WiFi and same subnet. Yet absolutely no details which are necessary to help form questions or provide answer.
Can you post the IP Netmask and Gateway of your Linux server and one of your mobile devices that can’t view the server?
Can you ssh into the Linux server from your mobile device?
I caught it. Seems others didn’t.
 342·30 days ago
Silly me for thinking the point of the widget was to allow you to see your week at a glance.
Same. It’s been on my list for too long.
Your network is probably configured with inconsistent subnets / netmasks. iOS / Android are on WiFi and getting a different subnet/netmask than your severs.
Edit: What does pinging the server with nmap mean? Are you checking open ports or pinging the server? That doesn’t make sense or at least leaves us with more questions with the way you worded that. Although the nmap utility can provide both of those answers, I’m not sure that’s what you meant. Technically nmap and ping are two different tools.
 28·1 month ago
I want my phone to be more like a computer and install what I want on it. But, I recognize the walled App Stores has maybe protected the common folks from turning our cellular network into a large, out of control, botnet.
With that said, I recognize computers exist. I guess I just hope it’s done with thought and care.
deleted by creator
deleted by creator
deleted by creator
All of my TVs have never seen an internet connection. I know the Apple hate is strong, but I’ve been throwing ATVs behind them since they were first released. No ads, no BS. Just a very clean experience that has never changed. I couldn’t imagine thinking putting a Google device from the largest advertising company on the planet would be some kind of upgrade.
prometheus and grafana … seems to be the universally accepted solution for self-hosted monitoring
Not exactly. There are many ways to do this. Most of us just use this solution because its easily scalable, highly documented and what we are probably already doing currently at work.
all built into one container
It’s nice to separate data sources from the dashboards and alerting platforms. It’s scalable and extremely light weight and gives you more options.
On top of prometheus not seeming useful on its own …
Yeah, that’s just not always true. Maybe for you, in your use case.
Installing a Prometheus node exporter gives you an easily accessible end point with JSON data that can be used however you like. Modularity is a good thing. Being able to swap parts in and out with other parts is a good thing.
If you haven’t figured it out yet, there is not an exact correct answer here, use what fits your needs. While I have a dash board setup in grafana, it’s not my main use case. Since the data is available from all the node-exporters on all my hardware, I wrote up my own alerting scripts and automations using python.
That’s the beauty of modularity and standards when self hosting.
 2·2 months ago
Thanks for the response. As I said, I’m aware RMA they just announced, current mitigations, bios updates and using Prime95 to test stability. I’m not seeing crashes with Prime95 since tweaking and eventually installing the latest ASUS bios with included microcode update. I have seen a crash in PrusaSlicer on occasion. Which is making me wonder.
Anyway, I was trying to understand if there’s an official test, software or process to determine if damage has occurred.
It seems there’s not.
Is there an official way to test your CPU if it’s damaged? Months ago I noticed issues when running Prime95 and found chatter on how to tweak the bios to improve stability. I’ve also been updating my bios and keeping an eye on their support page.
What I’m getting at is that I’m not sure if it was damaged. I have noticed an issue here or there random and not often, but I’m always going to wonder if my chip is bad or just normal bugs that occur time to time.
Which is unfortunate. Hiding projects, code and support behind discord is just wrong.
There are Linux and open source communities on discord. I mean, just think about that for a second. These people have chosen to put their stuff on a platform that has refused to acknowledge the existence of their OS / development platform. Every other post on Reddit in the Linux community before I left was about some half assed discord workaround.